Water Supply and Demand Models for Anticipatory Research and Education
WaterSim Phoenix
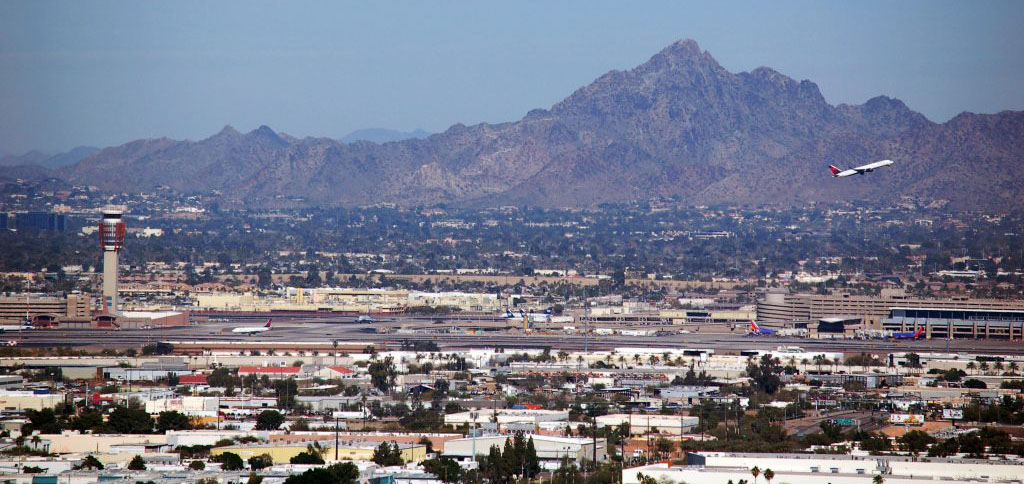
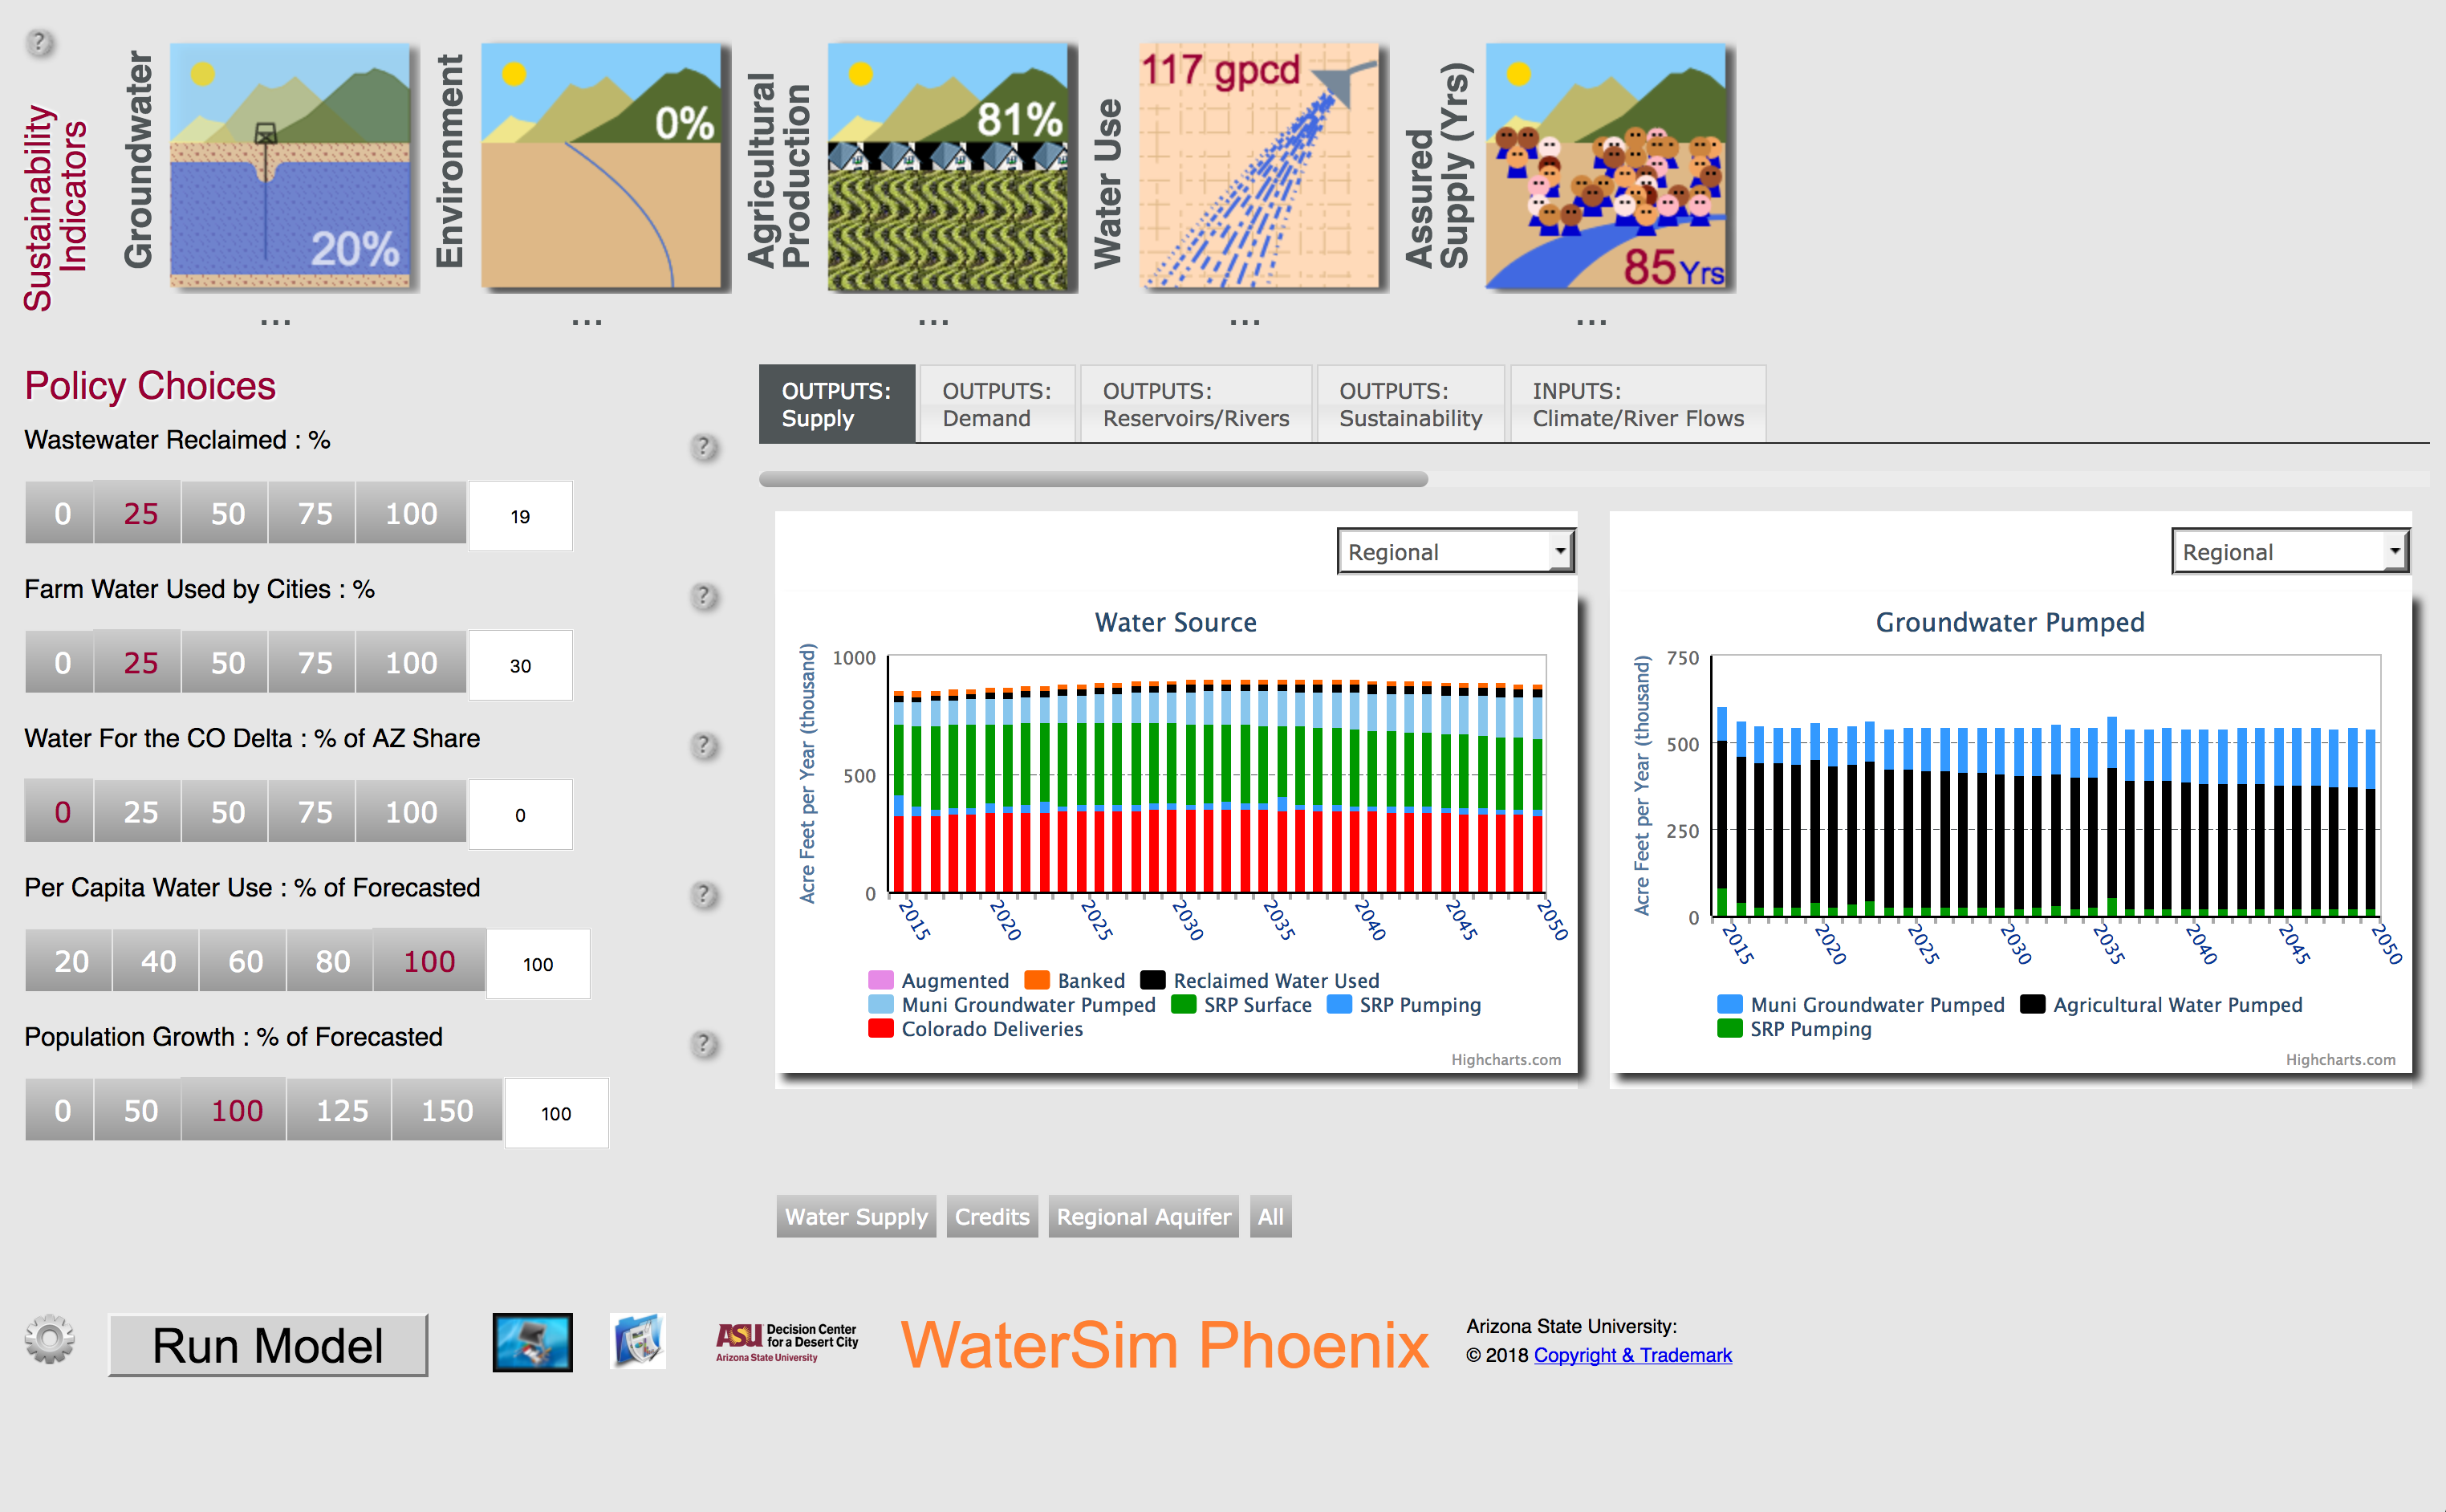
WaterSim Phoenix estimates water supply and demand for the 33 communities in the Phoenix Metropolitan Area. It is used to research the dynamics of water policy within the Phoenix region. A web browser user interface is used by teachers to explore in the classroom how water sustainability is influenced by various scenarios of regional growth, drought, climate change impacts and water management policies.
WaterSim West and WaterSim Arizona
WaterSim West is a water balance model that simulates the water supply and water use dynamics for twenty-five regions within the seven states of the Colorado River Basin, Arizona, California, Colorado, Nevada, New Mexico, Utah, and Wyoming. It is used to research water policy dynamics within the Basin. WaterSim Arizona is a web browser user interface for regions in Arizona used by teachers in the classroom.
WaterSim America
WaterSim America is delivered on an iPad and placed in a kiosk as an exhibit within Smithsonian’s Museum on Main Street Water/Ways exhibition touring the United States. It explores water issues at a state level. For the states of Arizona, California, and Utah, users will experience the WaterSim West model to explore issues for subregions of these states.
The Challenge
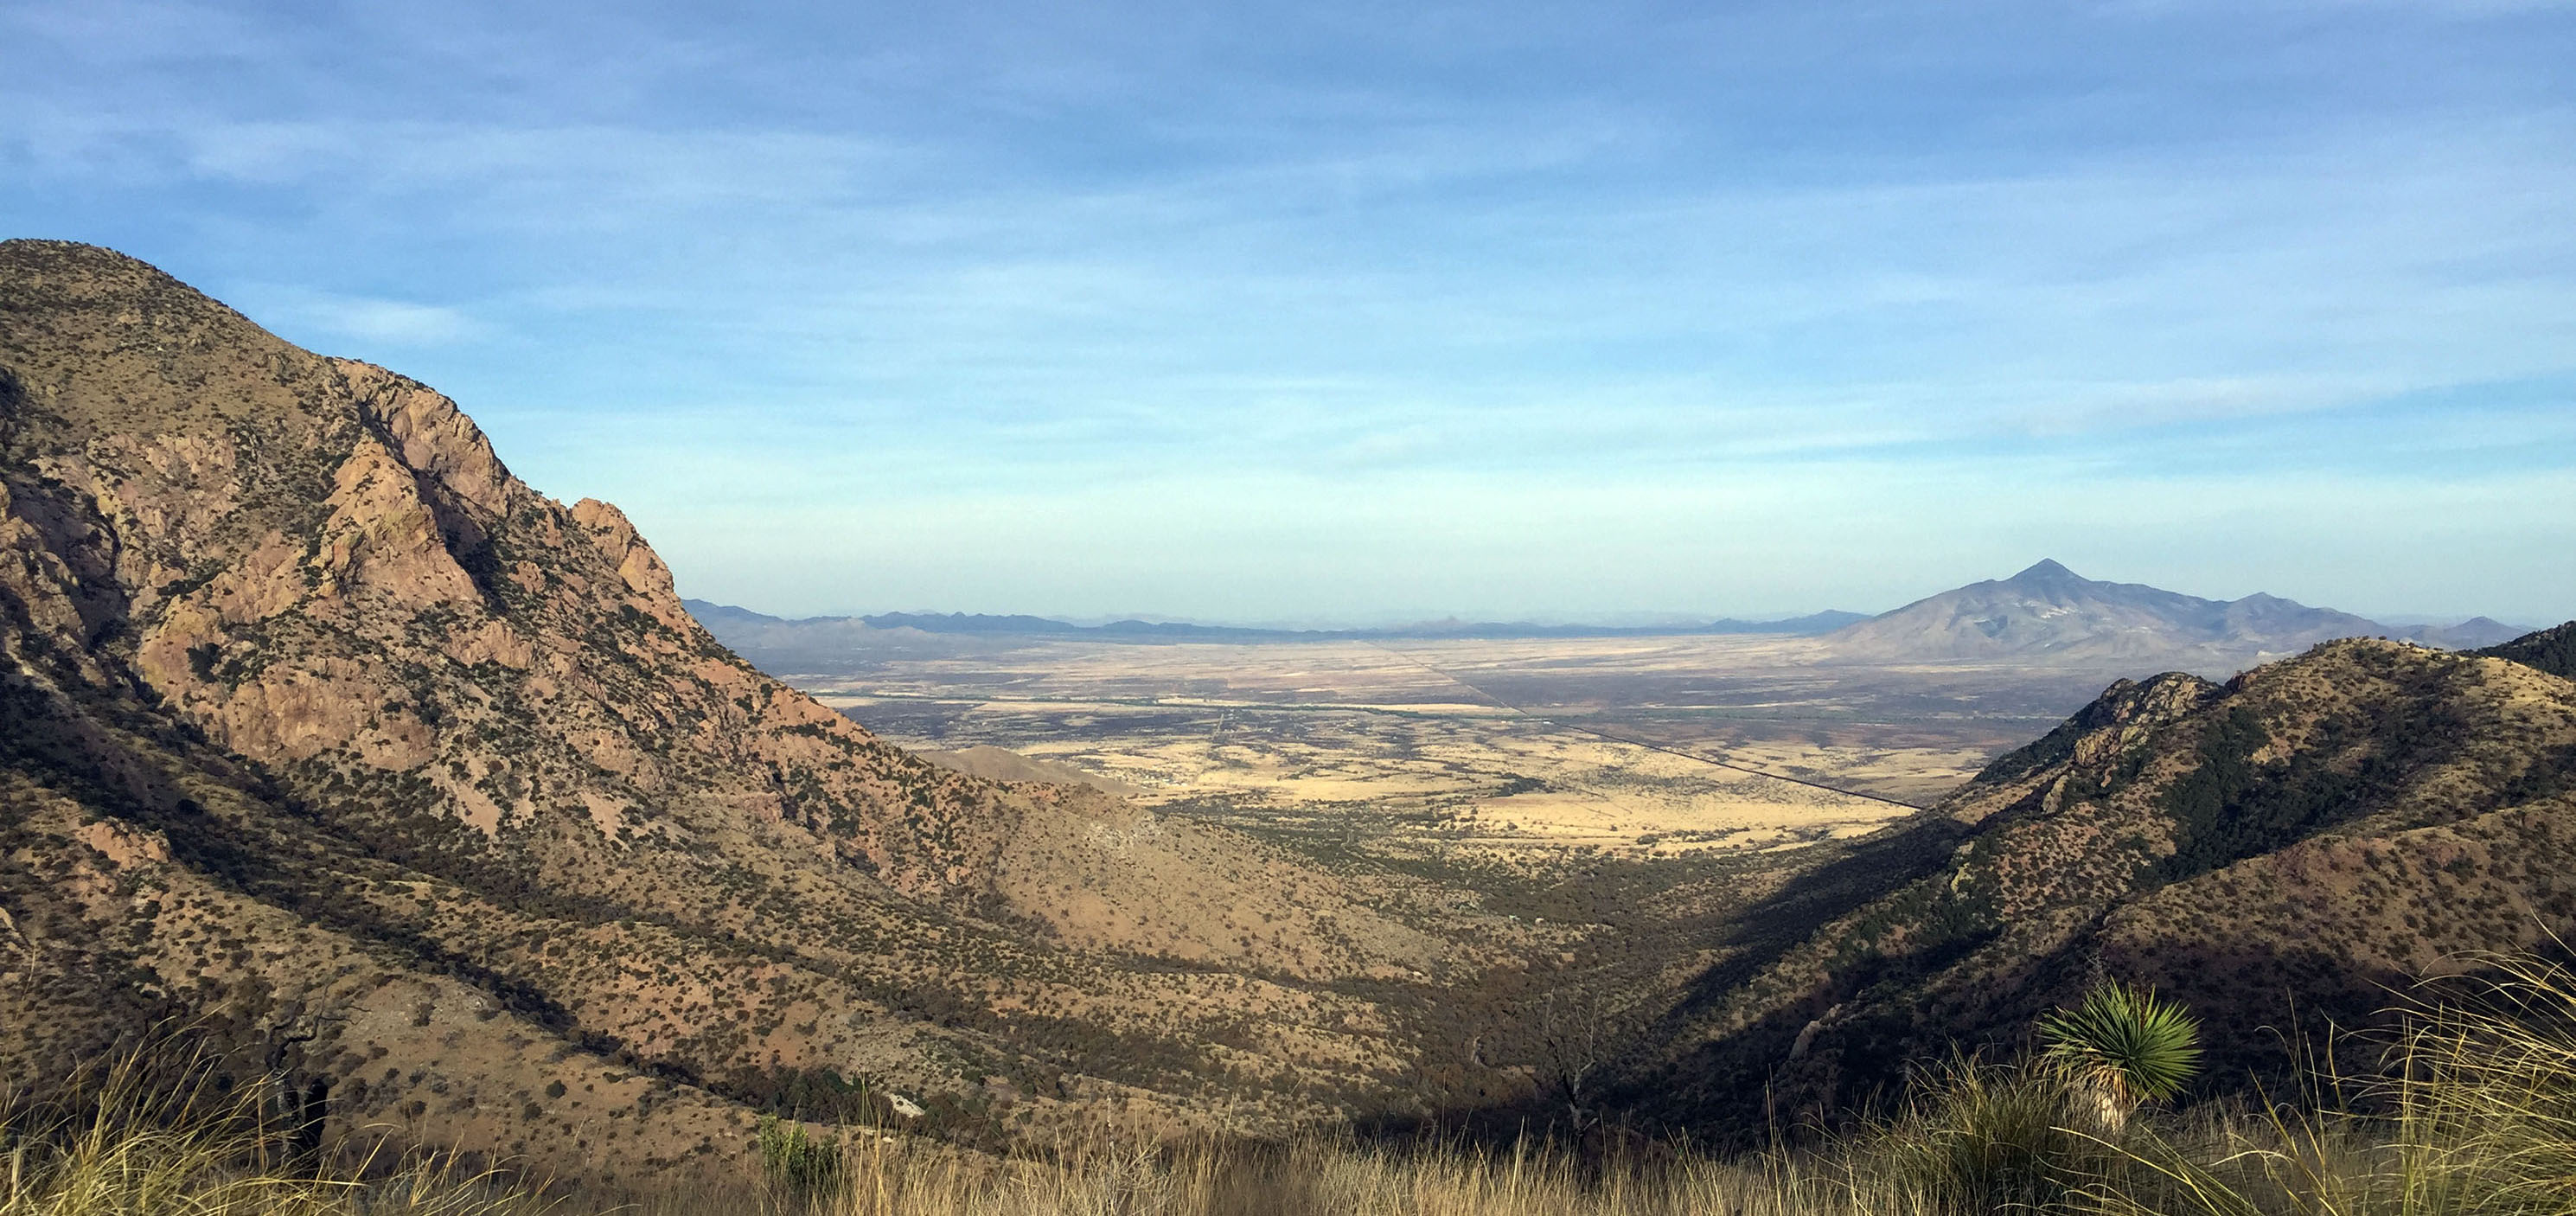
Most regions around the world are facing water sustainability issues of some kind. In some regions, these issues are just beginning to emerge and in others they are approaching a crisis level. But in all regions, there are driving forces such as population growth, economic and political dynamics, climate change, and even war that make the future of water sustainability highly uncertain.
For many places, these futures will create new challenges, including long-term drought, climate change impacts and austere public finances. These challenges require new approaches to water sustainability that focus on choices, priorities, and smart investments.
In many cases, the fundamental issue will not be where new water will come from, but rather how communities choose to use their available water to sustain their economy, quality of life, and natural environment. This new realm of uncertainty and changing strategies will require a new planning paradign, one of anticipate and adapt, where a range of futures and strategic strategies are anticipated and flexible adaptive plans are developed.
WaterSim
Modeling of natural and human systems is one way to anticipate the future and test various adaptive strategies. One fact that makes planning for water sustainability difficult is that water systems, natural and human, are highly context specific at different scales of geography. It is not possible to create a model of water systems in one region and expect it to be useful in another. To address this issue of geographic context and create models of human and natural water systems, DCDC has created a WaterSim platform that allows developing models for different geographies yet allows common access to research and visualization tools.
Arizona State University has created the WaterSim models to estimate water supply and demand for various places ranging from the Phoenix Metropolitan Area, to the Colorado River Basin, and various states in the United States. Users can explore how water sustainability is influenced by various scenarios of regional growth, drought, climate change impacts and water management policies.
WaterSim is a platform to utilize systems dynamics models. These “systems” models use a lot of data that is usually collected separately – including water supply, water demand, climate, population and policy data – and puts it together to give the user a system-level view of how these variables interact. It is “dynamic” because users can change one variable and see how that change affects the other variables.
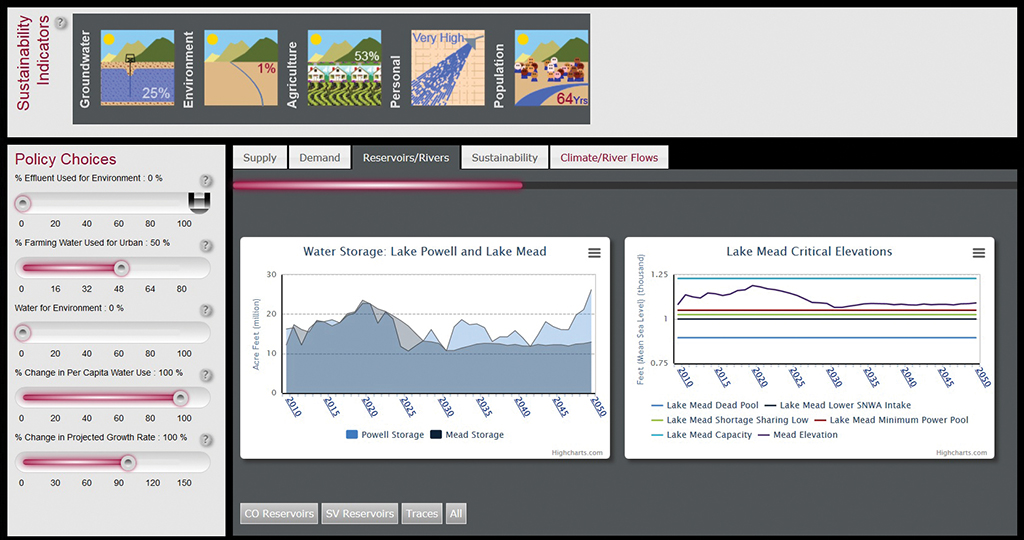
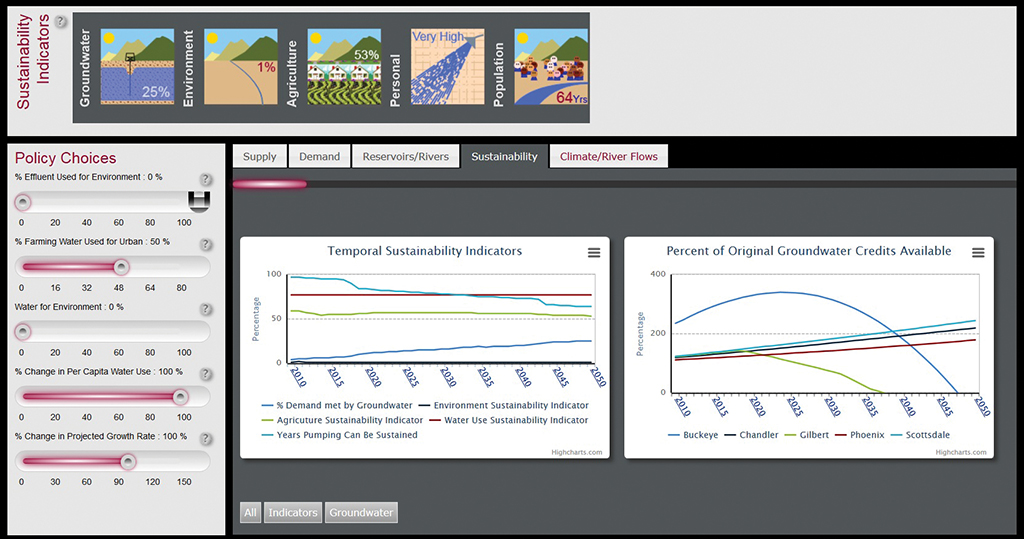
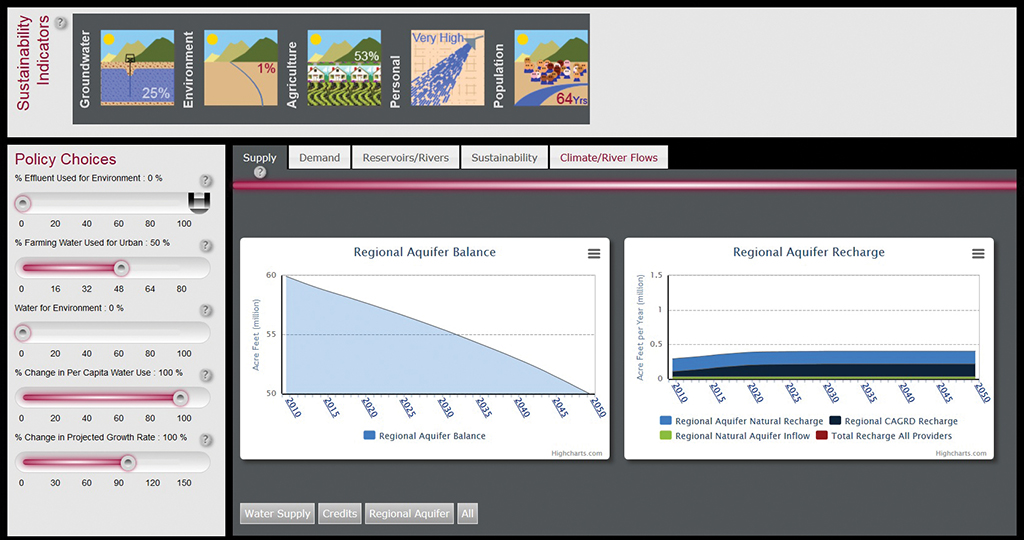
The WaterSim platform allows the systems dynamic models to use a common interface as a visualization tool. Rather than poring over pages upon pages of charts and tables, users can view the data in graphic form. They can make side-by-side comparisons to understand how one variable relates to another. Launched in 2007, WaterSim has now been used to create models for the Phoenix region, now in its sixth iteration, models at a state level used with the Smithsonian’s national Water/Ways exhibition, and for 25 regions within the seven basin states of the Colorado River Basin. All of these models have visualization tools that can be viewed online, through a web API, or in person at ASU’s Decision Theater.
The Variables
WaterSim allows users to change variables one-by-one, and then see how each change affects the water sustainability of the region and its various communities. By understanding best- and worst-case climate scenarios and the influence of various policy options on water supply and demand, decision makers can make choices informed by the best science available.
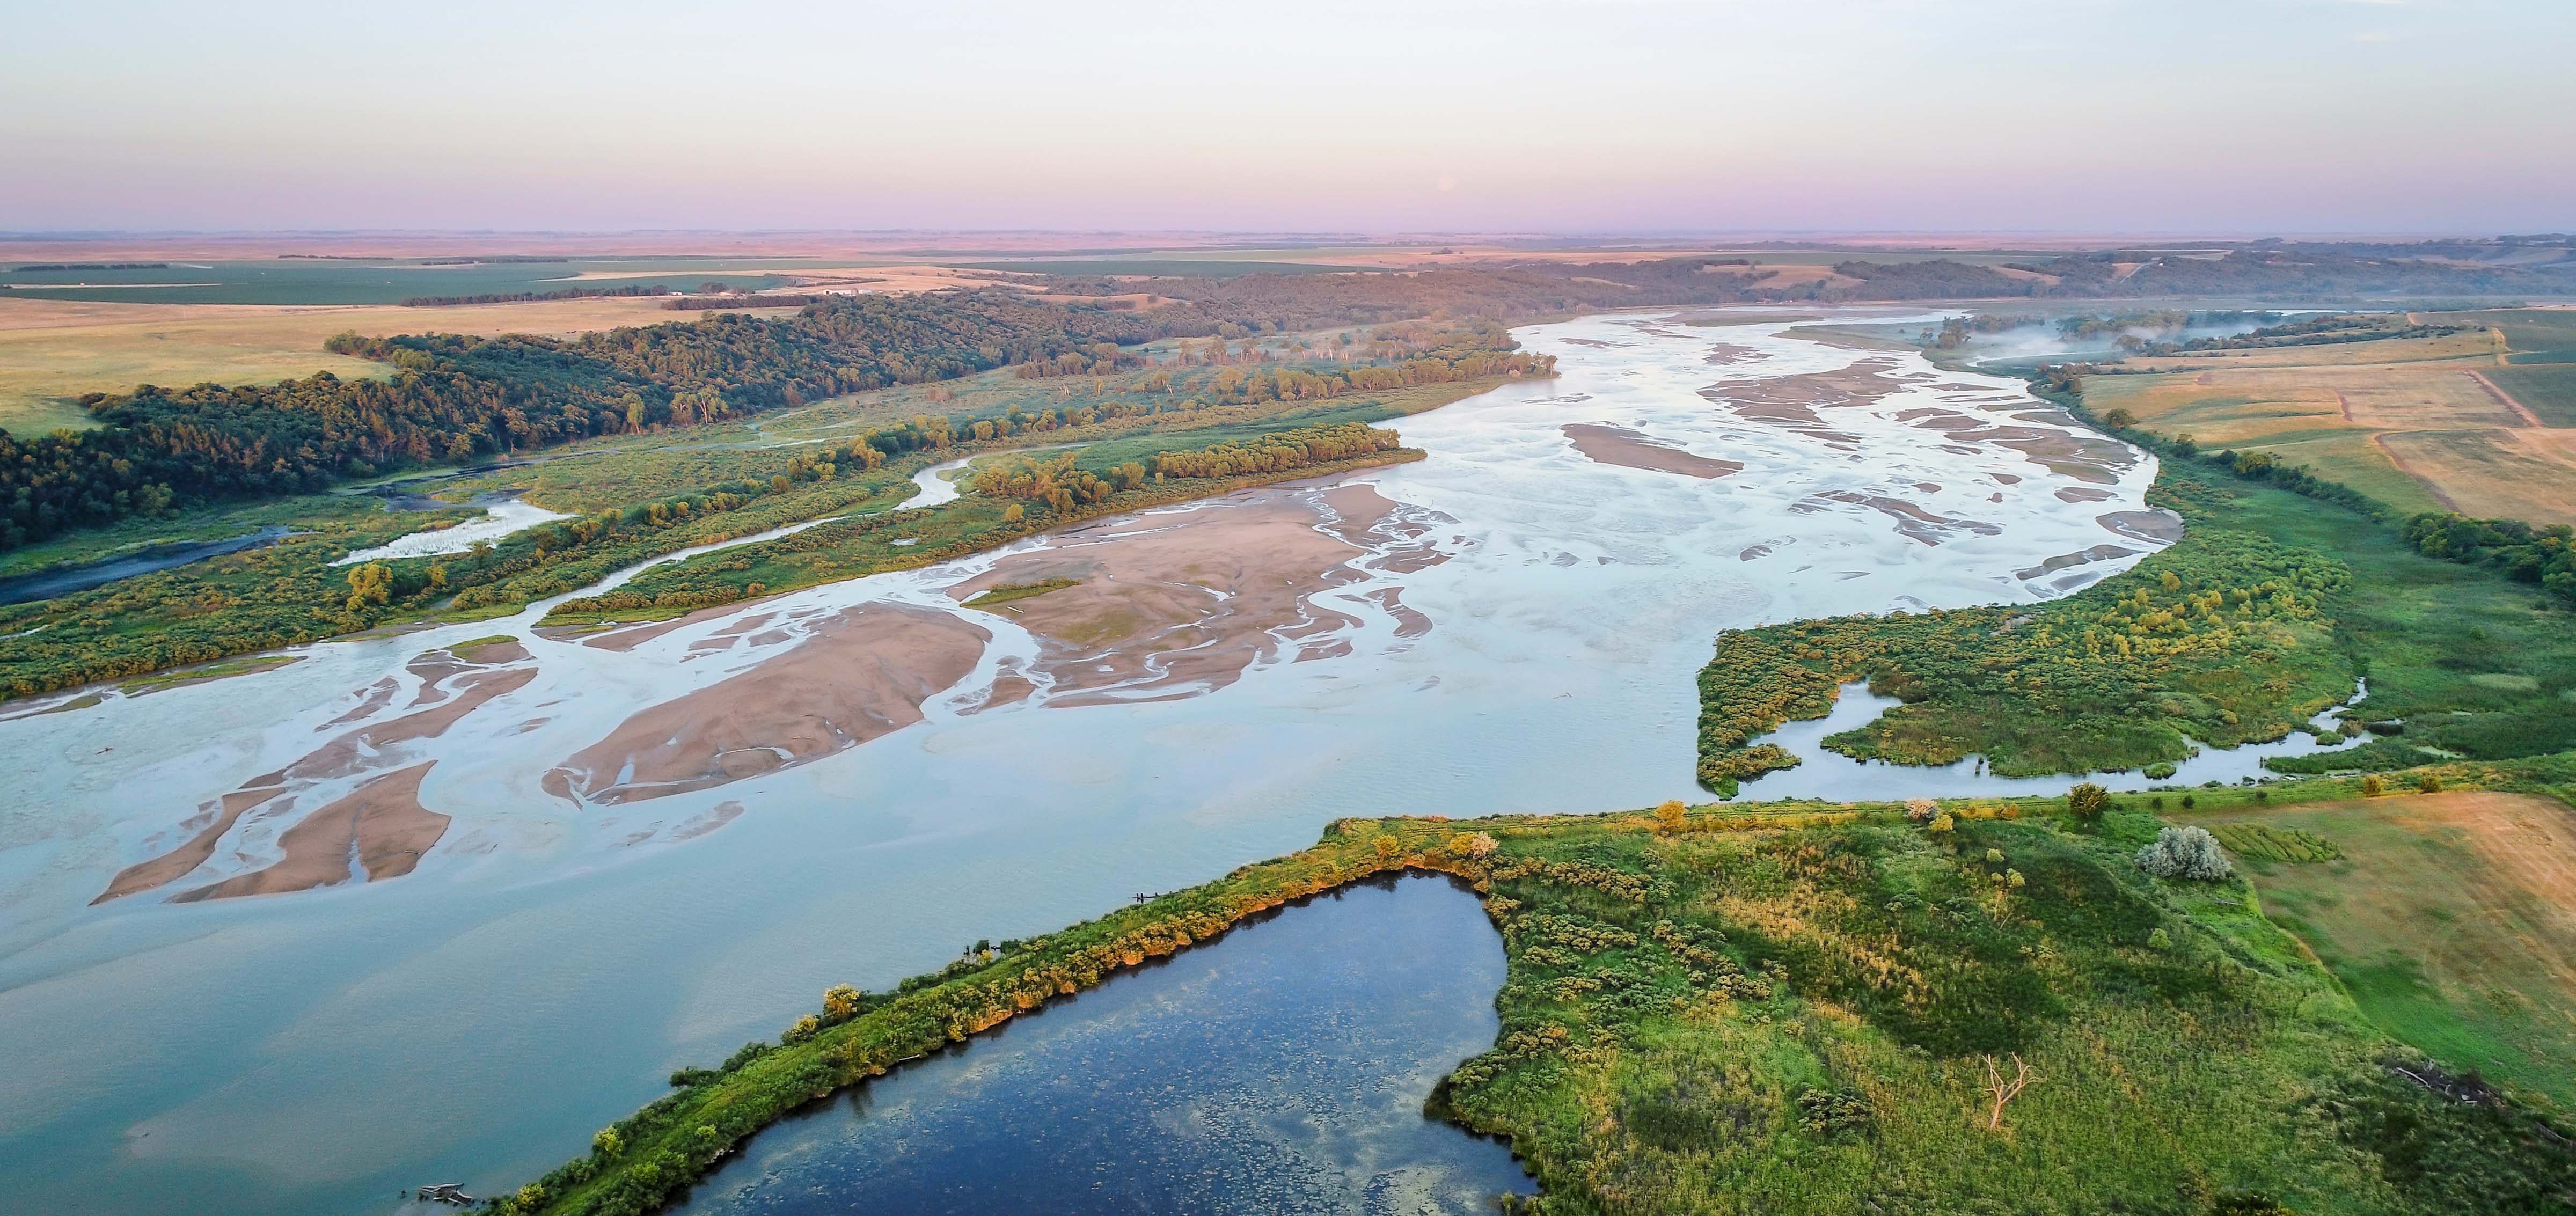
Water Supply – How much water is available, and where does it come from? In most regions, water comes from many sources including river water, groundwater, storm water, desalination of ocean water, and water reuse. Surface water and storm water supplies are primarily influenced by climate. Groundwater is influenced by recharge and demand. Reclaimed water is influenced by urban water efficiency and population growth.
Water Demand – Which communities use the most water per person? How much will those communities grow? Does that community have agriculture? How efficiently is water used? Water demand is primarily influenced by policy and population growth.
Climate Change – We cannot predict exactly how climate will affect water supply and demand in the future. What we can do is look to the past and anticipate the future. Global climate model results are not capable of predicting the future, but they can help us understand the range of possible futures, such as best and worst cases. Past patterns of river flows – decades with high flows, low flows or high variability from year to year, can help us understand how best- and worst-case scenarios might unfold over time.
Population Growth – The population of most places in the United States have been steadily growing for decades. Will it continue to grow at this pace, or will it grow faster or slower than predicted? WaterSim users can create best- and worst-case scenarios by changing this variable.
Policy Decisions – Who gets to use the water that is available? Individuals, businesses, farmers and ecosystems all require water, and some water must be stored for future use, as well. WaterSim users can manipulate allocation of water for these various uses.